Suppose you've made an improvement to your house, or the number of people living in your house has changed -- how can you tell how much that change has affected your energy bills? On the surface, this seems like a very simple question... you just compare the bills before and after, right? But utility bills change from month to month and from year to year, with the weather. So what you really need to do is predict what your bills would have been if your house hadn't changed but the weather did, and compare that prediction to what they actually were with the change and the weather.
The basic formula for comparing what actually happened with what would have happened is very straightforward:
difference = actual - predicted
A month or two after your house has changed, you have the actual bills, so that's no problem. But what do you use for a prediction? The bills from a few months ago are no good for comparison, because the weather was different. Even if you look at the same months from last year, the weather is likely to have been different enough from one year to the next to throw the prediction off. And what if the utilities changed their rates? Using the dollar values of last year's data is quick and easy, but chances are it's not accurate -- scroll down to the bottom of this page to see how inaccurate! Since I'm an energy geek, I thought I'd provide you the information and tools to make the right calculations!
An example case: a renter moves in
I'm going to use an example from my own household: my wife's brother moved in with us a few months ago (the single most effective thing one can do to reduce one's economic and environmental footprint), and we need to charge him for the additional energy he's using. Now, you might think I should just split the bills three ways, but I work from home, so charging him a third would be too much. Instead, just to reiterate, what I need to do is figure out what our energy bills would have been during those same months if he had not moved in, and compare that prediction to the bills we actually got charged.
This is just the example I had at hand, but you can use the exact same methodology described here (and the same spreadsheet) to figure your savings from adding insulation or installing a new furnace or windows or solar panels, or the added cost of heating and cooling a new room on your house.
One other quick note: I'm using dollars and MCF (thousand cubic feet) of natural gas and degrees Fahrenheit (˚F) in this example, and in the spreadsheet. If your utility measures gas in therms or CCF (hundred cubic feet) or some other measurement, that's fine. If your bills are charged in euros or yen or pounds instead of dollars, that's also fine, and if you measure temperature in ˚C, that's great! It makes no difference to the calculations.
Step 1: Separating rates from fees
The first step is to separate out the rate each utility charges you for the energy you consume (including all taxes and other charges that depend on the amount you consume) from the monthly fee(s) they charge you no matter what. Now, some electric customers, especially large commercial and industrial buildings, are charged a sliding scale depending on how much energy they consume, plus they may have a "demand charge" for the peaks in their consumption. But most of us residential customers are charged just one flat rate and a monthly flat fee by each utility, so it's pretty simple to figure out what's what. ("Flat" in this case means that when you graph it, it looks like a straight line -- see below.)
(You might ask, why not just read that information off the bill? Because if your bills are like the ones I've seen, there are half a dozen charges making up the rate and another half dozen making up the fee, and it's hard to tell which is which, and some of them vary with the cost of fuel and other economic factors while others don't. It's actually easier -- and more accurate -- to start with the final charges and work backwards. Bear with me!)
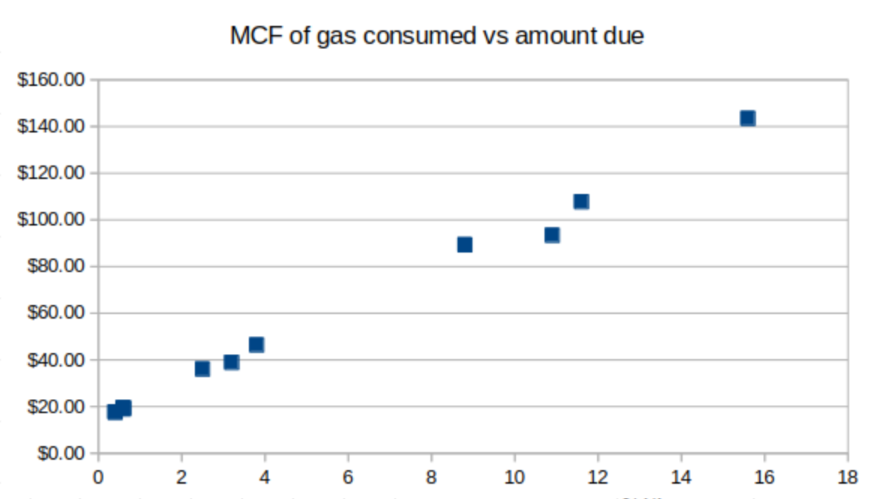
Above is an example of what you would see if you graphed your gas bill. The rate is the slope of the line formed by the individual data points, and the monthly fee is the amount you'd be charged if you consumed zero energy. You may remember from math class that this is called the "y-intercept," the place where the slope line intercepts the "y" (vertical) axis of the graph. I'll be using the less intimidating term "baseline" instead.
You may also remember from math class that the formula for the slope of a line is
slope = rise ÷ run
in other words,
rate = ((max. $) - (min. $)) ÷ ((max. energy) - (min. energy))
Specifically in this example,
rate = ($143.45 - $17.65) ÷ (15.6 - 0.4 MCF) = $8.28/MCF
What this means is, we don't need a whole year of past utility bills, we only need two: the highest and the lowest. Once we know the slope of the line (the rate), we can find the baseline (the fee). This is our first chance to apply that equation we started with: actual minus predicted. If we pretend for the moment that we don't know the amount of the lowest bill, we can attempt to predict it using only the rate and compare the actual lowest bill to what the slope predicts, and that gives us the baseline:
monthly fee = (actual lowest bill) - (lowest bill we'd predict given only the rate)
which is the same as:
monthly fee = (minimum amount due) - (rate * minimum energy consumed)
specifically in this case:
monthly fee = $17.65/mo. - ($8.28/MCF * 0.4 MCF/mo.) = $14.34/mo.
We repeat the same steps for the electric bills, so now we know the rate and the monthly fee for each utility!
Step 2: Separating weather-related consumption from baseline consumption
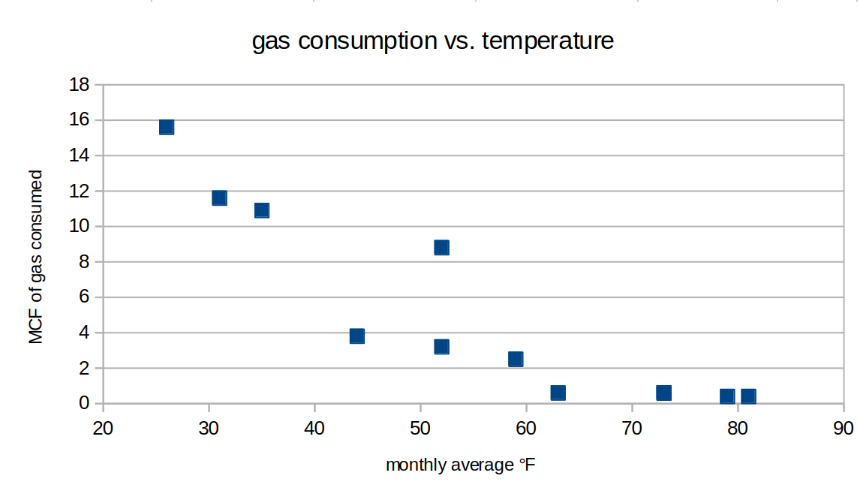

Next we need to figure out how much your consumption is affected by the weather. If you graphed your heating bills against the average (mean) temperature each month, you'd see something like the graph at left, and if you did the same for your cooling bills, you'd see something like the graph at right.
There are a couple dots out of place because sometimes the meter reader doesn't come read the meter on the right day, but you can see there's a very clear trend here: as temperature goes up, gas consumption goes down and electricity consumption goes up. (If you use electric space heaters or a heat pump as well as a furnace, your graphs will be less straightforward -- more on that below. These graphs are from a house with no electric heat.)
Unfortunately there are three problems with using these graphs to predict future energy consumption:
- They're not straight lines, so we can't just use two data points to find the slope and baseline like we did with the other graph.
- The gas graph slopes the wrong way, in case you hadn't noticed.
- The average monthly temperature hides some important information: were there a few really cold days and hot days, or was the weather uniform all month long? It makes a big difference to your thermostat!
Fortunately, we can solve all three of these problems by using a different statistic instead of average temperature: degree days. A heating or cooling "degree day" is the difference between the daily average (mean) temperature and the temperature that causes your heating or cooling system to come on, usually 65˚F. That doesn't mean your thermostat is set at 65˚, in fact it almost certainly isn't, but that's the average outdoor temperature when your indoor temperature triggers the thermostat. You can see in the graphs above that 65˚ is almost exactly the point where both graphs start to curve up. It might be a different temperature on your bills, so I encourage you to graph them and see!
You may be wondering where to find degree days ... I'll get to that below. The important thing for now is that when you graph your consumption against degree days instead of temperature, the graphs magically transform into straight lines, as shown in the graphs below:
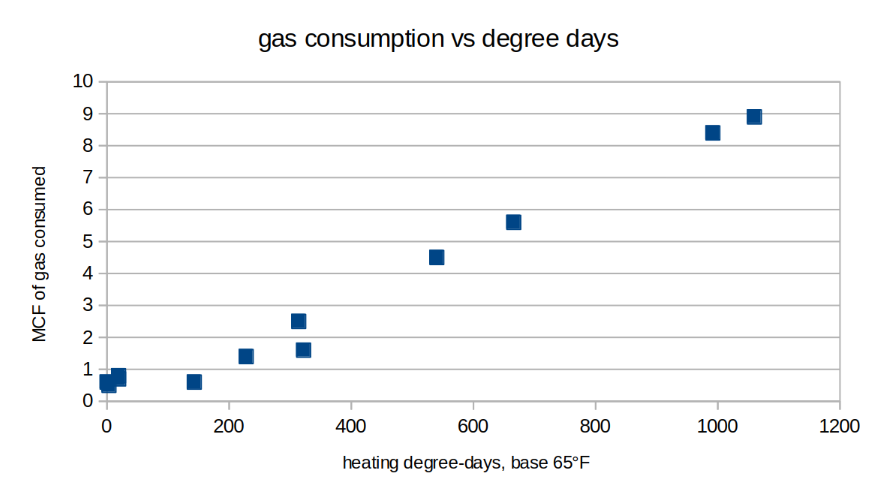

The slopes and baselines of these graphs take on new meaning, showing the consumption of specific appliances in your home. Notice that the line is almost entirely straight, which is great because degree days are a little cumbersome to look up, but more importantly because I don't need as many data points -- I actually only need two, the highest and lowest!
furnace consumption = slope = rise ÷ run
furnace consumption = ((max. gas consumed) - (min. gas consumed)) ÷ ((max. heating degree days) - (min. heating degree days))
furnace consumption = (15.6 - 0.4 MCF) ÷ (1420 - 3.39 HDD) = 0.01 MCF/HDDwater heater consumption = actual - predicted = (min. gas consumed) - ((furnace consumption) * (min. heating degree days))
water heater consumption = 0.4 MCF/month - (0.01 MCF/HDD * 3.39 HDD) = 0.36 MCF/monthair conditioner consumption = slope = rise ÷ run
air conditioner consumption = ((max. kWh) - (min. kWh)) ÷ ((max. cooling degree days) - (min. cooling degree days))
air conditioner consumption = (1083 - 286 kWh) ÷ (500 - 17.9 CDD) = 1.63 kWh/CDDlights & appliances consumption = actual - predicted = (min. kWh) - ((air conditioner consumption) * (min. cooling degree days))
lights & appliances consumption = 286 kWh/month - (1.63 kWh/CDD * 17.9 CDD) = 266.78 kWh/month
(If you use electric heat, you will need to do an additional calculation, just like the furnace consumption calculation, but using kWh and heating degree days, looking at the minimum and maximum numbers from just the wintertime rather than from the whole year.)
Finding degree days
There are a number of Web sites that will give you heating and cooling degree days, notably DegreeDays.net, but the one I recommend is WolframAlpha.com. Just enter "heating degree days" or "cooling degree days" in the blank and it will automatically guess your location and set up a form for you to enter the range of dates you're interested in. Be sure to enter the dates in the format it expects, or it won't work.
Predicting what bills would have been
So... now we have all the information we need to predict what our bills would have been if we hadn't made the changes we made. All we need to know is what the weather was like (the heating and cooling degree days) during the time period in question.
Using our example where our renter has been with us for August and September:
predicted gas consumption = ((heating degree days) * (furnace consumption)) + ((water heater consumption) * (number of months))
predicted gas consumption = (73.48 HDD * 0.01 MCF/HDD) + (0.36 MCF/month * 2 months) = 1.52 MCFpredicted total gas bill = ((predicted gas consumption) * rate) + ((monthly fee) * (number of months))
predicted total gas bill = (1.52 MCF * $8.28/MCF) + ($14.34/month * 2 months) = $41.22predicted electrical consumption = ((cooling degree days) * (AC consumption)) + ((lights & appliances consumption) * (number of months))
predicted electrical consumption = (918 CDD * 1.63 kWh/CDD) + (266.78 kWh/month * 2 months) = 2032.14 kWhpredicted total electric bill = ((predicted electrical consumption) * rate) + ((monthly fee) * (number of months))
predicted total electric bill = (2032.14 kWh * $0.10/kWh) + ($6.33/month * 2 months) = $214.86
How did the bills change?
Now all that remains is to return to our original equation to find out how the bills have changed. Remember to add up all the bills from the months you're looking at.
difference = actual - predicted
difference in gas bills = (total gas bills after the change) - (predicted total gas bill)
difference in gas bills = $39.90 - $41.22 = -$1.32difference in electric bills = (total electric bills after the change) - (predicted total electric bill)
difference in electric bills = $242.70 - $214.86 = $27.84total difference = (difference in gas bills) + (difference in electric bills)
total difference = -$1.32 + $27.84 = $26.52
So in this example, our renter owes us only $26.52 for two months of utilities. Not a bad deal for him! (The gas bill went down for the same reason the electric bill went up: the appliances he brought produce heat!)
The wrong calculations
You may be wondering how the calculations would have come out if I had skipped all this analysis, not worried about the changing weather, and just used last year's bills from those same two months to predict the two months he's rented with us. Let's see:
difference = (this year's bills) - (last year's bills)
total difference = ($39.90 + 242.70) - ($37.27 + $190.79) = $54.54
That's more than double! Our renter should be plenty glad I'm an energy geek! Of course, if the weather had been different, the wrong calculations could have come out in his favor instead, but I think we can all agree it's better to be honest and charge for the weather we actually had this year instead of the weather we had last year.